Find public statistical data through Google
Public statistical data, such as unemployment rates or population numbers, doesn't need to be hard to find or, more importantly, hard to understand. Google is making it easier to find and use important public statistical data from governments and other sources. This data is included in Google.com search results and displayed as interactive graphs that you can customize and share with others.
Find public statistical data through GooglePublic statistical data, such as unemployment rates or population numbers, doesn't need to be hard to find or, more importantly, hard to understand. Google is making it easier to find and use important public statistical data from governments and other sources. This data is included in Google.com search results and displayed as interactive graphs that you can customize and share with others. Watch a short video on using Google to find public data
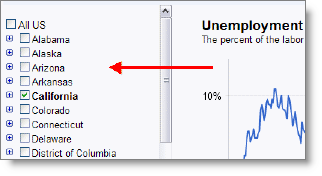
See public data resultsIf you've ever done research involving large datasets, you know that it can take hours to comb through databases in order to find and analyze trends. Anyone who searches for U.S. unemployment rates or population numbers on Google.com will see relevant statistics and graphs included in their search results. You can even search by state or county (but not by city).
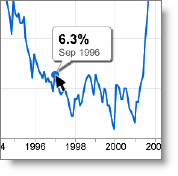
Want to give it a try? Try these example searches: [ Florida unemployment rate ], [ Santa Clara county population ]. Not using Google.com? Go to http://www.google.com/webhp?hl=en&gl=us to try these searches. Customize and share public data graphsClicking a public data result will take you to a larger interactive graph where you can compare the available data. (Having problems viewing the graph? Make sure you're using the latest version of Flash.) Even people who normally shy away from statistics should find these dynamic graphs easy to use and understand. Here are a few suggestions for working with these graphs:
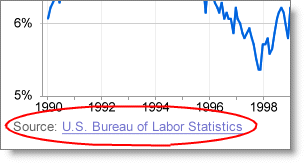
Have other questions about using these public data graphs? Visit the Google Web Search Forum. Data sourcesThe unemployment rate and population data you see in Google come from the U.S. Census Bureau and the U.S Bureau of Labor Statistics. Keep in mind that even the most recent public statistic is a bit old by the time it's published, since it takes time to collect and process data. Information on accessing the original datasets Want to make your public data more visible?We are constantly looking to expand the scope of public data that people can find through Google. To learn more about making your organization's data available through the public data feature of Google search, see our information for data publishers. |

No comments:
Post a Comment